 Go to UK site
 You're currently here
Go to UK site
You're currently here
You're currently here
Go to UK site
You're currently here

| 19-20 May 2026 |

|
| Queensland Government Department of Transport and Main Roads Policy, Planning and Investment Division Olympic and Paralympic Coordination Branch Executive Event | |

| 15 May 2026 |
|
| Transit Systems NSW Leadership Forum | |

| 12-14 May 2026 |
|
| Queensland Government Department of Primary Industries Information Technology Partners Facilitator Development Programme | |

| 11-12 May 2026 |
|
| Transit Systems NSW Executive Event | |

| 23 Apr 2026 |
|
| Queensland Government Department of Transport and Main Roads Project Kick-Start | |

| 22 Apr 2026 |
|
| Queensland Government Department of Transport and Main Roads Network Services and Operations Division Leadership Forum | |

| 21-22 Apr 2026 |
|
| Queensland Government Department of Transport and Main Roads Corporate Division Executive Event | |

| 14-16 Apr 2026 |
|
| Transit Systems NSW Organisational Improvement Programme | |

| 24-26 Mar 2026 |
|
| Universal Improvement Skills Public Course in Melbourne | |

| 17-18 Mar 2026 |
|
| Queensland Government Department of Transport and Main Road Network Services and Operations Division Executive Event | |

| 13 Mar 2026 |
|
| Queensland Government Department of Transport and Main Roads Leadership Forum | |

| 10-12 Mar 2026 |

|
| Incommunities Universal Improvement Skills | |
Universal Data Skills
This course has the potential to revolutionise the way data is used in your organisation, your team and by you personally.
Universal Data Skills covers both the theory and practice of data collection, display, analysis and reporting in an easy to understand and practical manner. Previous participants have varied from people who haven't studied anything about data since they were at school to professional statisticians - in the same group.
Importantly, we also look at Statistical Process Control, the origin of all contemporary approaches to organisational improvement. We cover the history, how this has influenced modern management and then how it can be applied in a straightforward manner back in the workplace.
To quote a long-standing client, Universal Data Skills "…is the best meal I've ever had when the menu's looked so boring" (SJ).
 |
 |
 |
 |
|||
|
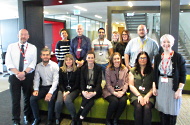
Universal Data Skills Kinetic May 2021 |
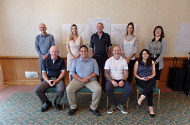
Universal Data Skills Thirteen January 2019 |
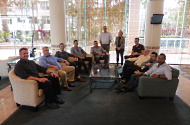
Universal Data Skills Blackpool Transport January 2019 |
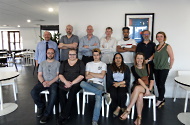
Universal Data Skills Transit Australia Group November 2018 |
Duration and who should attend
Duration
3 days
Who should attend?
| • | Chief Executives, Directors, senior, middle and junior managers |
| • | Anyone involved in performance measurement at a departmental or organisational level |
| • | Analysts and statisticians |
This course is aimed at graduates of Universal Improvement Skills and Control Your Projects. The contents, in particular how to measure and analyse process performance, enhance what has already been learned. A customised version of Universal Data Skills can also be run as an additional module to the Strategic Improvement Programme and Organisational Improvement Programme.
Style and structure of the course
Despite the name, Universal Data Skills is not a course about data. It is a course about using data for improvement. It is a highly practical course and you will be able to immediately apply what you learn back in the workplace. There are plenty of exercises and time for you to apply the learning to your own real-life situations and data with our help.
 |
 |
 |
 |
|||
|
Universal Data Skills Regenda July 2018 |
Universal Data Skills Transit Australia Group October 2017 |
Universal Data Skills Southeastern June 2017 |
Universal Data Skills Thirteen Group May 2017 |
A brief overview of the course
Day 1
| • | Scene setting |
| • | The Experiment on the Red Beads - as run by Dr W. Edwards Deming on his 4 day seminars |
| • | Twelve principles that underpin the use of data in organisational improvement |
| • | An introduction to variation and the difference between Common Causes and Special Causes. How variation affects your processes and how to use SPC to go about reducing this to guarantee predictability and reliability. |
Day 2 - Statistical Process Control
| • | The history |
| • | The Funnel Experiment - another of Dr Deming's classics, this one to illustrate the dangers of tampering with stable processes |
| • | Process Behaviour Charts (also known as Control Charts), the Standard Deviation, calculating Control Limits and looking for patterns in the resulting data - nothing special going on, blips, shifts, drifts, chaos |
| • | Process Capability and targets |
| • | How to use Pareto Charts and Ishikawa Diagrams in the context of data analysis |
| • | Bad practices exposed, how a 'common sense' approach to using data may be ruining your organisation |
| • | How to use data in projects - both steering (particularly how to identify projects) and doing |
| • | How to collect, display and analyse customer satisfaction data |
Day 3
| • | Better use of graphs including tips for good graphs | ||||||||||||
| • | How to select and use the best graph to present your data including:
|
||||||||||||
| • | The four interdependent activities when using data for improvement: collection, display, analysis and reporting | ||||||||||||
| • | Dashboards - what they are, where the ideas come from, how to design and use them | ||||||||||||
| • | If you are able to provide some real data from your organisation, we will use that to illustrate many of these |
Download
Click here for the Universal Data Skills Briefing Note.
The Experiment on the Red Beads
 |
 |
 |
 |
|||
 |
 |
 |
 |
|||
 |
 |
 |
 |
|||
 |
 |
 |
 |
|||
 |
 |
 |
 |